
T1_Tables_Collection
IELTS Writing Task 1: 'table' essay
Today I'm going to explain my thinking process when I answer an IELTS Writing Task 1 question. We'll use this question (
Cambridge IELTS 7, page 30):
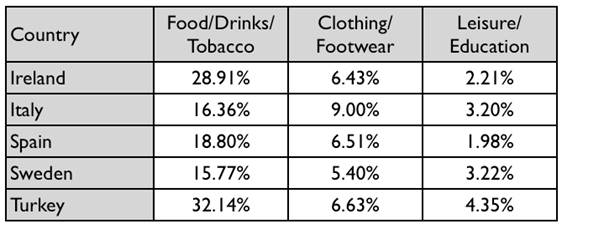
The table below gives information on consumer spending on different items in five different countries in 2002.
Percentage of national consumer expenditure by category - 2002
Before I worry about what language to use, it's really important to understand the information, and decide how to organise it. This is what I'm thinking:
1. I know that I can write a short introduction by paraphrasing the question.
2. I look for an overall trend. I can see that the food/drinks/tobacco category has the highest percentages, and leisure/education has the lowest.
3. Now I want to write two main body paragraphs. I need to select something to say about each country. Remember, there is no rule about what information you select; everyone will do this differently.
4. I look for the highest figures in each category: I can see that Turkey has the highest figure for food/drinks/tobacco AND for education/leisure. Italy has the highest figure for clothing/footwear.
5. So, I'll write a paragraph about Turkey and Italy.
6. My final paragraph needs to talk about Ireland, Spain and Sweden.
7. Maybe I'll point out that Ireland has a high figure for the first category, Spain has the lowest figure for education/leisure, and Sweden has the lowest figures for the first AND second categories.
8. I don't need a conclusion because I have already mentioned a general trend in point 2.
Try writing an essay following these steps. You can compare your essay with mine next week.
Here's my band 9 essay following the steps in last week's lesson:
The table below gives information on consumer spending on different items in five different countries in 2002.
Percentage of national consumer expenditure by category - 2002

The table shows percentages of consumer expenditure for three categories of products and services in five countries in 2002.
It is clear that the largest proportion of consumer spending in each country went on food, drinks and tobacco. On the other hand, the leisure/education category has the lowest percentages in the table.
Out of the five countries, consumer spending on food, drinks and tobacco was noticeably higher in Turkey, at 32.14%, and Ireland, at nearly 29%. The proportion of spending on leisure and education was also highest in Turkey, at 4.35%, while expenditure on clothing and footwear was significantly higher in Italy, at 9%, than in any of the other countries.
It can be seen that Sweden had the lowest percentages of national consumer expenditure for food/drinks/tobacco and for clothing/footwear, at nearly 16% and just over 5% respectively. Spain had slightly higher figures for these categories, but the lowest figure for leisure/education, at only 1.98%.
Note:
- Which information did I choose to include in my 'summary' paragraph?
- Why did I use past and present tenses in paragraph 2?
- How did I group the information for paragraphs 3 and 4?
Q13. Task 1 - Graph (Solved) (Table graph)

Solution:
The two tabular charts depict the visits abroad by UK residents by purpose of visit and the destinations of visits for the years 1994 to 1998.
At the first glance, it is observed that the main reason for traveling abroad has been the holidays in all the 5 years followed by business and visits to friends and relatives. There was an approximate 30% increase in the holiday figures from 1994 to 1998 while in other purposes the figures inclined slightly. The maximum visits abroad by UK residents were in 1998.
Moving further, Western Europe was the favorite destination for UK residents traveling abroad and the figure jumped by an approximate 25% in 5 years. Visits to North America doubled from 919 to 1823 from the years 1994 to 1998.
Overall, the biggest reason for visits abroad was holidays and the favorite destination was Western Europe.
Sample task
You should spend about 20 minutes on this task.
Write a report for a university lecturer describing the information in the table below.
Write at least 150 words.

Your task
Complete the Task One report exercise above. Spend only 20 minutes.Then look at the notes and the sample answer below.
Sample answers
We will now compare two sample answers, one better than the other. How well does each one follow the guidelines?
Sample answer 1
The table shows how people in different age groups spent their leisure time in Someland. It can be clearly seen that the amount of leisure time available varied considerably across the age groups.
Teenagers in Someland spent 1,200 hours a year watching TV and those in the over 70s group spent 100 hours less at 1,100. They spent 150 hours on socialising with 4 or less people compared with 200 hours at the other end of the scale. They spent 350 hours socialising with 4 or more people compared with 25 hours. The teenagers spent 450 hours on group exercise but retired people didn’t do any.
In conclusion, we can see that in Someland the teenagers and retired people prefer to spend their free time in different ways.
Teacher's comments on the sample answer
“The report structure is clear and well organised with an introduction, body and conclusion.
The candidate uses repetitive grammatical structures and vocabulary which would bring the mark down considerably. The tense used is not appropriate as there is no indication on the table that the figures refer to the past. Also the reader doesn’t know who is being referred to in the two sentences on socialising. The word ‘prefer’ in the conclusion is inappropriate because the table does not give any indication of people’s reasons for spending their time on one activity rather than another. Someone may choose indoor rather than outdoor activities because of their health although they would prefer to go outside.
In terms of task requirements the report has serious problems. Although in writing about a table you will have the difficulty of there being too much information to put into a 150 word report, you can’t solve this problem by ignoring whole sections of the table. In this case the candidate simply compared two age levels and ignored the rest.”
Sample answer 2
The table shows how people in different age groups spend their leisure time in Someland over the course of a year. It can be clearly seen that the amount of leisure time available varies considerably across the age groups and that people of different age levels have very different ways of spending their leisure time.
According to the figures, as people age in Someland their social lives reduce. Teenagers and people in their twenties spend on average 500 hours per year on socialising and 350 hours of that time is with a group of more than 4 people. Although the total hours of socialising in their 30s, 40s, 50s and 60s is fairly constant (between 300-350), socialising with more than 4 people drops dramatically to 50 hours in the 30s and 40s age groups and only 25 from 50 years old. Group and individual exercise follow a similar pattern.
People of all ages spend a good part of their leisure time on entertainment such as TV/video viewing and cinema. In both cases, teenagers and retired people spend around twice as much time as those who are at working age. Home entertainment ranges from just over a thousand hours for teenagers and retired people and an average of 600 hours for everyone else. Cinema accounts for 100 hours of the teenagers and retired people’s leisure time and 25-50 hours for the rest.
In conclusion we can see there is a significant trend towards solitary and smaller group activities as people grow older and that teenagers and retired people spend a lot more time on entertainment than those of working age do.
Strategies for improving your IELTS score
Selecting information
Like the line graphs your report should be structured simply with an introduction, body and conclusion. Tenses should be used appropriately.
Use two standard opening sentences to introduce the table and your report. These opening sentences should make up the first paragraph. Sentence one should define what the table is about; that is, the date, location, what is being described in the graphs etc. For example:
The table shows how people in different age groups spend their leisure time in Someland over the course of a year.
Notice that the sample opening sentence does not simply copy the words used on the graphic material. Copied sentences will not be assessed by the examiner and so you waste your time including them.
Sentence two (and possibly three) might sum up the overall trend. For example:
It can be clearly seen that the amount of leisure time available varies considerably across the age groups and that people of different age levels have very different ways of spending their free time.
Notice the tense used. In this case there is no date given and so we must take the table information as being current now.
The body of the report will describe the information presented in the table in detail. You will need to decide on the most clear and logical order to present the material. Generally you will choose one of the categories given in the table; that is, the age or activity in the example task above. Your choice would depend on whether you could see the most significant trends occurring by age group or by activity. In this case distinguishing the age group is your primary concern in describing this table, and you would do this by highlighting some differences between the activity preferences of the age groups.
Ideally your report should end with one or two sentences which summarise your report or draw a relevant conclusion.
Grammar and vocabulary
You will receive a higher mark if your writing uses a range of structures and vocabulary correctly rather than a limited number.
Selecting your information
In completing this task it is important that you cover all of the information given. However, this does not mean that you should note every detail. In tables there is invariably too much information for you to mention each figure. You will therefore need to summarise the table in meaningful segments. In other words, you will describe the significant trends in your report.
To see the trends in a table, start by finding patterns under the horizontal and vertical headings. In the sample task you would analyse the age groups and activities. We can see that at different times in their lives Someland people have more or less free time and their priorities for how they spend their free time are different. In analysing the activities we can look for which age groups spend more time on individual or group, cheap or expensive, home or outdoor, strenuous or restful activities. By describing trends in this way, we can avoid having to describe every age group across every activity.
SAMPLE #14 WRITING TASK 1(20 MINS)(AT LEAST 150 WORDS)(ACADEMIC)
[SUBSCRIBE TO POST-PAY W1 or PRE-PAY PP3 [ Basic Plan] for writing training only and know the strategies and tips to achieve your intended score with live trainer evaluating your tasks. Subscribe to PRE-PAY PP4 to learn complete IELTS tests and achieve your target band.Contact us now!!!]
The tables below show information on Australian tourism
for the years 1991 to 1999.The first shows the number of visitors coming to Australia and the second shows the number of Australian residents traveling overseas.Write a report for a university lecturer describing the information shown below.
[NOTE:- If you are unable to view this picture clearly, click here AUSTRALIAN TRAVELERS]
SUGGESTED APPROACH
The answer should clearly cover the information given adequately by comparing the numbers leaving and departing rather than focusing on each group individually.
SAMPLE ANSWER
There were 4,459,510 visitors in 1999, representing a 7% increase in visitor arrivals from 1998.This increase indicates a recovery from the 3.5% decline in visitor arrivals experienced in 1998, which was uncharacteristic of the high increases recorded earlier in the decade.
While the number of foreign visitors. coming to Australia increased in 1999 after a fall in 1998, the number of Australian residents departing for overseas has been increasing over the last six years.Until 1996 the annual percentage increase in Australians visiting overseas was smaller than the increase in visitor arrivals. However, in 1997 and 1998 the percentage increase in Australians traveling abroad was greater than the increase in international visitors coming to Australia, with those departing up by 7% and 8% respectively when compared with visitors arriving (up 4% in 1997, and down 4% in 1998). In 1999 the 7% increase of inbound visitors compared with only a 15% increase in outbound visitors. The number of inbound visitors remained higher than the number of outbound visitors, by just over 1.2 million persons in 1999.(177 words)[Band 9]
Look at this table and complete the description. For some spaces you may need to use more than one word.

The table shows how_____money people spent on 4 different items in the United Kingdom in 1998.
It is immediately apparent that adults spent _____of their money on food, electronic equipment, music and videos than children did. Adults spent just over a_______of their income on these items, while children spent84%of money on the same goods. One major difference between adult males and females is that women spent as much as39%of their money shopping for food, whereas men spent more than_______on food. While it seems that____men or women spent a significant______of money on music and videos, we can see______of men’s income went on electronic equipment in contrast to just1% for women.
Generally, boys and girls spent their money in a similar way. Music was the most popular item at around40%, followed by videos at approximately18%and food at just10%. The one striking difference between the genders was in electronic equipment. Here boys (18%) spent almost________as much as girls (5%).
One conclusion is that there were differences in patterns of spending both in age and gender.
This is my answer. There may well be other possible correct answers. If you have something different you want checked, just leave a comment.
The table shows howmuchmoney people spent on 4 different items in the United Kingdom in 1998.
It is immediately apparent that adults spentlessof their money on food, electronic equipment, music and videos than children did. Adults spent just over athirdof their income on these items, while children spent 84% of money on the same goods. One major difference between adult males and females is that women spent as much as 39% of their money shopping for food, whereas men spentjust over a thirdon food. While it seems thatfewmen or women spent a significantamountof money on music and videos, we can seea tenthof men’s income went on electronic equipment in contrast to just 1% for women.
Generally, boys and girls spent their money in a similar way. Music was the most popular item at around 40%, followed by videos at approximately 18% and food at just 10%. The one striking difference between the genders was in electronic equipment. Here boys (18%) spent almostthree timesas much as girls (5%).
One conclusion is that there are differences in patterns of spending both in age and gender.
The table below presents the number of children ever bornto women aged 40-44 years in Australia for each year the information was collected since 1981.
Summarise the information by selecting and reporting the main features, and make comparisons where relevant.
Write at least 150 words.

Test Tip
You should ‘signpost’ general statements, i.e. introduce them with expressions such as:
The table/pie chart/graph/etc. shows...
The most significant change...
Another noticeable trend...
Overall...
You must also support general statements with detailed information from the table/graph/etc.
Model answer 字数太多,不适合这么写
The table shows the number of children born to women aged 40?44 years in Australia in 1981, 1986, 1996 and 2001.
In 1981, women aged 40-44 years were only marginally more likely to have had two children than three children (29% vs 27.4%) or four or more children (27.6%). Similarly, by 1986, women of this age were considerably more likely to have given birth to two children than three children (35.6% vs 27%) or four or more children (18.9%).
In 1996 and 2006, the proportions of women aged 40-44 years who had given birth to two children were almost identical, though the proportions who had given birth to three children or to four or more children had decreased. In these more recent periods, women were more likely to have had two children than three or more children - a trend that was most marked in the most recent period (38.2% vs 24.6% in 1996; 38.3% vs 21.5% in 2006).
While two-child families now predominate, the number of women who had given birth to only one child increased progressively from 7.6% in 1981 to 13.2% in 2006.
In 1981, similar proportions of women aged in their early forties were childless or had given birth to only one child (8.5% and 7.6% respectively). By 2006, 15.9% of women were childless and 13.2% had given birth to only one child.
Overall, by age 40-44 years, the proportion of women who have had three or more children has fallen considerably since the 1980s, while the proportions who have had no children, or only one or two children has increased.
(266 words)
Q26. Task 1 - Graph (Table)

Solution:
The tabular graph illustrates the percentage of British households who owned a range of consumer durables between 1972 and 1983.
From an overall view, it is apparent that the percentage of durables ownership increased over the years. The greatest increase was in telephone ownership, rising from 42% in 1972 to 77% in 1983. Next was the central heating ownership, rising from 37% of households in 1972 to 64% in 1983. The percentage of households with a refrigerator rose by 21% over the same period and of those with a washing machine by 14%.
Households with vacuum-cleaners, televisions and dishwashers increased by 8%, 5% and 2% respectively. In 1983, the year of their introduction, 18% of households had a video recorder. Over the period the proportion of British houses with central heating doubled and of those with a phone increased from under a half to over three-quarters.
There were also big increases in the ownership of washing machines and refrigerators, which suggests rising living standards of the British people over the period.
The chart below shows average hours and minutes spent by UK males and females on different daily activities.

I've made the following essay into a gap-fill exercise.
The table compares the average ______ of time per day that men and women in the UK spend ______ different activities.
It is clear that people in the UK spend more time ______ than doing any other daily activity. Also, there are significant differences between the time ______ by men and women on employment/study and housework.
On average, men and women in the UK ______ for about 8 hours per day. Leisure ______ ______ the second largest proportion of their time. Men spend 5 hours and 25 minutes doing various leisure activities, such as watching TV or doing sport, ______ women have 4 hours and 53 minutes of leisure time.
It is noticeable that men work or study for an average of 79 minutes more than women every day. By contrast, women spend 79 minutes more than men doing housework, and they spend ______ ______ as much time looking after children.
Fill the gaps using these words:
doing, up, over, spent, while, sleeping, sleep, twice, amount, takes
Posted bySimoninIELTS Writing Task 1|Permalink
CORRECT ANSWERS FROM SIMON:
1. amount
2. doing
3. sleeping
4. spent
5. sleep
6. takes
7. up
8. while
9. over
10. twice
You should spend about 20 minutes on this task.
The table below shows the proportion of time different age groups spend on various Internet activities.
Summarise the information by selecting and reporting the main features, and making comparisons where relevant.

Sample Answer
The table provides information about the proportion of time people of different ages spend on different activities on the internet. The people are divided into 6 age groups which range from 10 to 50 years old and over. The categories of activity on the Internet include online shopping, browsing news and sports sites, game playing and social media use.
The information shows that Internet usage varies greatly between people of different ages.
The youngest age group (10-15) spends the most time playing games while the oldest age group (50+) spends the least amount of time on this activity. People aged 16-40 spend more of their time on social network sites than those who are over 40 years old, with the 16-20 age group spending 51% of their time on this particular activity. Most adults participate in online shopping, those in the 30-39 age group spend more than a third of their time on this activity, while those over 50 years old only spend 10% of their time shopping.
Overall, older people, those over 40, spend most of their time on news and sports sites in contrast to younger people who play more games and spend more time on social media.